
From conversations at Tableau Conference and Tapestry, I find it really interesting to learn how users got their start with Tableau, and the difference it has made in their work and personal lives. A shout out to Mike Moore and Trina Arnet for encouraging me to share my story, and encourage others as well!
 Growing up, academically I was always interested in math, not because I found it easy, but because math was more easy than other subjects. I never graduated summa cum laude, received honor roll, or any other academic recognition for that matter. When it came to school I just thought, “Whatever, I won’t figure it out, and that’s fine”. Instead of academics, I gravitated towards sports and the arts. I would spend recesses in the art room or dark room, and outside of school I was always at gymnastics.
I was first introduced to Tableau when I went to a job interview. I had just graduated (from the University of Cincinnati) with a bachelors in economics and a minor in information systems. In my spare time, I was pursuing freelance photography. My future manager to be, Eric Duell, recognized my two skill sets (analytics + art) and showed me Tableau at my interview. He asked what I thought, and if I would be interested in learning it? Of course the answer was “Yes!”. Thanks Eric for your encouragement at this early stage in my career. You really pushed me (and still do) to always improve and ask questions.
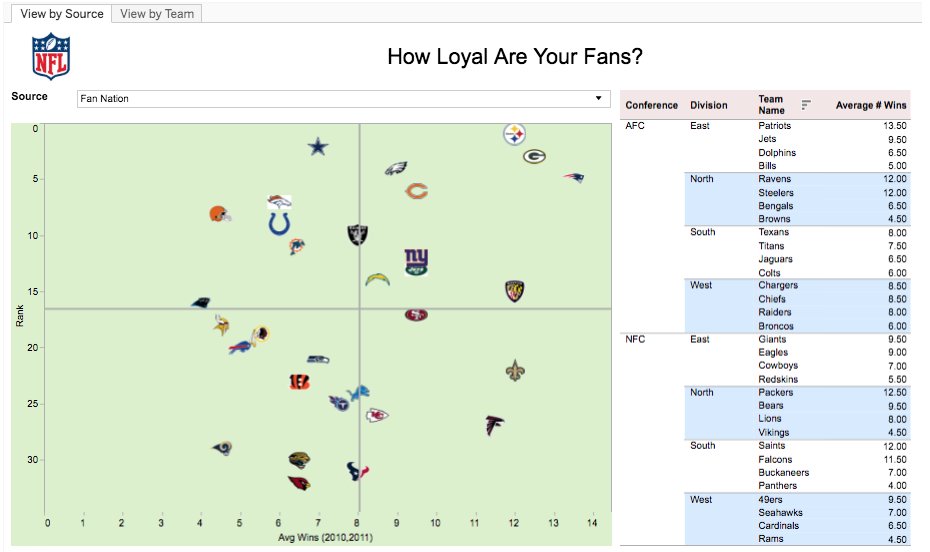
I remember, later that year, the first time I was selected for Viz of the Day, for my visualization on NFL fan loyalty. I couldn’t believe that I had been picked, and that people thought my work was worth something. I had a new sense of confidence in my work and myself.
 In 2013 I attended my first Tableau conference. The experience was very intimidating because I only knew 1 other person attending the conference! I remember the Zen Masters being called out onto the stage and in this moment I thought, “Wow! That’s so cool!”, “I want to get that good!”.
After the conference I really started to kick things into gear. I created a Twitter account and got to work on Tableau Public. I looked for data sets that I found interesting, visualized them, and continued to post them on Tableau Public. To my surprise, people really enjoyed them. Shortly after moving to the Washington DC area in 2014, I started my blog and started to present at area Tableau User Group meetings. I created short “how to” posts on things I had found really useful and questions/answers that I was being asked at work. Thanks Cesar Picco and Erin Simpler-Kellett for encouraging me through these next couple of years!
Come 2015 I was really excited for Tableau Conference. I looked forward to meeting and talking to the many friends I had made around the country, and the world! I also had the opportunity to present at Fanalytics that year, thanks to Ben Jones. Later that year, I was in a meeting when a business user asked me and my team about creating a tile map in Tableau. I went back to my desk and sought out to find the Tableau solution. An hour later I emerged with the first Tableau tile map. I couldn’t believe the acceleration the idea took off with in the Tableau community! Thank you Matt Chambers for running with my idea. This is the type of collaboration that makes the Tableau community so special.
2016 started with a bang. I was invited to organize the Washington DC Tableau User Group. I couldn’t believe that I had chosen me out of everyone in the DC area! In addition to the TUG I was invited to co-found the DC Data + Women group alongside Emily Kund, Erin Simpler-Kellett, and Julie Kim. That year I spent a lot of time learning how to plan and host events. I cannot thank Jordan Scott enough for her help in all of these events!


In addition to all of the work I was doing in the community, I had Zen Master on my mind. For those of you that know me, I have not been a Zen Master - and that’s ok! Yes, I was disappointed, who wouldn’t be? But, that year I was truly tested to decide what was really important to me. I learned that I didn’t need the Zen Master designation to make myself feel accomplished. I wanted to do things because I wanted to learn and get better, not because I needed other people’s acceptance or approval. Thank you Nelson Davis for echoing this feeling and thank you Matt Francis and Emily Kund for awarding me with the Community Leadership Vizzie that year.
Going into 2017 I thought, “it’s time for a break”. I didn’t stop everything, but all the time outside of work that I was devoting to Tableau blogs and vizzes could now be spent on other things! I took that time to figure out what was next, what I wanted to learn in the future, and where I could improve. With some encouragement by Eric Duell, I took a user experience course and started to learn more about visual design.
After some unexpected changes, I decided to make the jump to full time freelance in 2018. This had been an idea in my mind for many years and after some discussion with my fiance we decided that I should go for it! The transition to being my own boss and running my own company of one has been an amazing experience (to be documented next). I can’t thank my fiance, Chuck, enough for the endless support that he has given me along this whole journey.

So, now we get back to the original post topic, How has Tableau changed my life? Tableau has given me a voice, a confidence, and leadership that I didn’t know was in me. I never in my wildest dreams would have thought that I would own my own business, would regularly speak in front of 100+ people, and they would actual listen! Or that I would have thousands of followers on Twitter. Or friends across the world. I found something that i’m truly talented at and passionate about. Thank you Tableau and the community. You have always made me feel welcomed and important.
Brittany’s Tableau Timeline
2012
|
Jun
|
First introduced to Tableau
|
Sept
|
First Viz of the Day - Loyal Sports Fans
| |
2013
|
Aug
|
Viz of the Day - A Family NFL Outing
|
Sept
|
First Tableau Customer Conference & first tweet
| |
2014
|
May
|
First freelance client
|
Jul
|
Move to Washington DC
| |
Oct
|
Started my blog, BFongData
| |
Dec
|
Viz of the Day - Explore Christmas Tree Varieties
| |
2015
|
Jun
|
Viz of the Day - Visualizing Age Inequality by Gender
|
Oct
|
Tableau Conference, Presented at Fanalytics
| |
Nov
|
Created and blogged about my first tile map in Tableau
| |
2016
|
Jan
|
Became organizer of the DC Tableau User Group
|
Feb
|
Co-founded DC Data + Women
| |
Jul
|
Became a Tableau Ambassador
| |
Sept
|
Viz of the Day - Makeover Monday, Shipping Companies
| |
Nov
|
Received Tableau Wannabe Community Leader Award
| |
2017
|
May
|
First Data + Women Teen workshop
|
Jun
|
Viz of the Day - National Spelling Bee
| |
2018
|
Jan
|
Founded BFongData, LLC
|
May
|
Viz of the Day - Who Told it Better?
|


0 comments:
Post a Comment